Participants saw a SoundSketcher visualization for each sound pair and adjusted one slider from “Noise” to “Clear tonal pitch”.
1. Consent and profile
Participants first read the Greek instructions, gave consent, and entered basic music-background information.
2. Six paired stimuli
Each trial used a stimulus folder containing one tonal and one noise audio example.
3. Slider judgment
The response was a continuous 0-1 value indicating the preferred visual mapping between noise and tonal pitch.
4. Anonymous logging
Responses were saved as anonymous session records for later agreement and distribution analysis.
Try the task
This is a non-saving showcase of the original task. Choose any of the six stimulus pairs, load the real SoundSketcher visualization, play the pair, and move the slider to redraw the mapping exactly like the experiment.
Choose one of the six stimulus pairs.
NoiseClear tonal pitch
Current value: 1.00
Mapping Settings?
Audio Features?
Sketch Characteristic
Invert Mapping
Min | Max
×
Audio Features Explanation
Spectral Centroid: Indicates where the "center of mass" of the spectrum is located, often used to describe the "brightness" of a sound. Higher values represent more high-frequency content.
F0-SC Combo: A combination of fundamental frequency (F0) and spectral centroid. It balances the pitch perception with the brightness of the sound.
F0 | CREPE: Fundamental frequency estimation using the CREPE model, providing high precision for pitch tracking.
Yin F0 | Librosa: A pitch detection algorithm implemented in Librosa. It estimates the fundamental frequency using the YIN algorithm.
Yin F0 | Aubio: Similar to Librosa's implementation but uses the Aubio library for fundamental frequency detection.
F0 | CREPE Confidence: Confidence level of the pitch estimation from the CREPE model. Higher values indicate more reliable pitch detection.
Spectral Flux: Measures the rate of change in the power spectrum, indicating the onset of new frequencies or dynamics in the sound.
Spectral Flatness: A measure of the noisiness or tonal quality of the sound. Higher values indicate more noise-like signals, while lower values are more tone-like.
Spectral Bandwidth: The range of frequencies present in the signal, often used to describe the width of the spectral distribution.
Zero Crossing Rate: Counts how often the signal changes sign (crosses the zero line), commonly associated with noisiness or percussiveness.
Amplitude: Represents the loudness or energy level of the audio. Higher amplitudes correspond to louder sounds.
Brightness: Describes how much high-frequency content exists in the sound, contributing to its sharpness and clarity.
Sharpness: Indicates how harsh or cutting the sound feels, often associated with high frequencies.
Loudness: A perceptual measure of sound intensity, taking into account the sensitivity of human hearing at different frequencies.
Loudness-ZCR: A hybrid measure combining loudness and zero-crossing rate to capture both intensity and noisiness.
None: Disables the mapping for this feature, leaving it unassigned.
×
Mapping Settings Explanation
Functionality
Inversion: Reverses the mapping, placing high values at the bottom of the canvas and low values at the top.
Sliders: Control the minimum and maximum range of each mapped feature.
Randomizer: Randomly assigns features to the available mapping slots for exploration.
Reset: Resets all settings, including feature mappings, slider values, and inversion states.
Hotkeys
F: Toggles the settings menu (e.g., fold/unfold).
A: Resketch the score.
S: Trigger the randomizer functionality.
D: Resets all settings to their default states.
Z: Select preset A.
X: Select preset B.
C: Select preset C.
Spacebar: Play the audio.
×
Sonificators Explanation
Purpose
Oscillator Sonification: Uses basic waveforms (sine, sawtooth, triangle, and square) to represent match sketch characteristics to oscillation parameters.
Granulator Sonification: Explores sound texture and temporal aspects by segmenting and playing grains of audio.
Functionality
Waveform Selector: Allows you to toggle between waveforms for oscillator sonification. Pitch, volume, and other parameters are defined by line characteristics.
Granulation: Parameters like grain size, spread, and playback speed are defined by the line characteristics.
Play/Stop Toggle: Simple button to start or stop the playback.
Limitations
Development Stage: These tools are under active research and development, so their performance may vary.
Experimental Nature: Designed for exploration and not optimized for high-performance audio synthesis yet.
Line Length
Line Width
Color Saturation
Color Lightness
Angle
Dash Array
Y Axis
Key findings
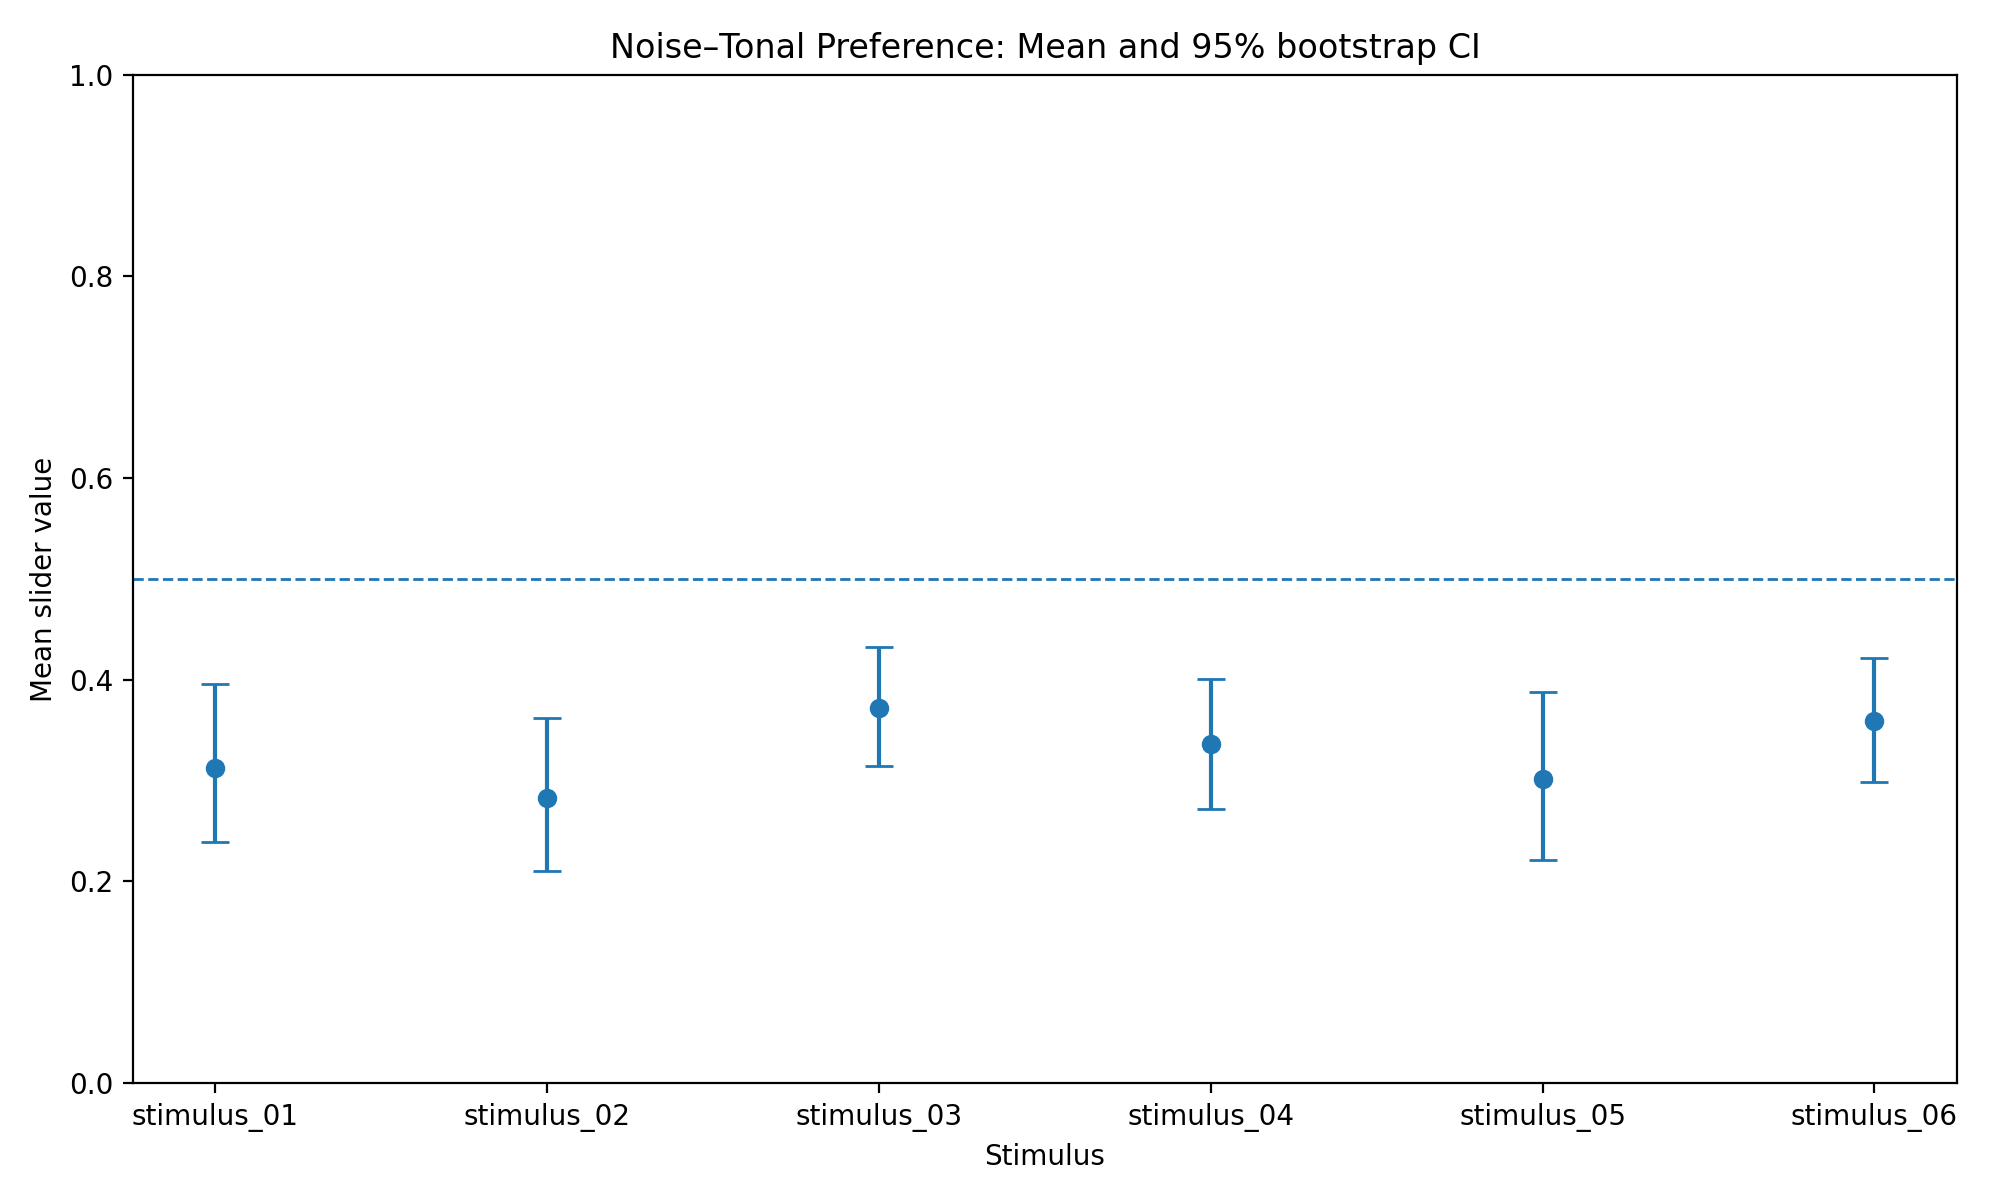
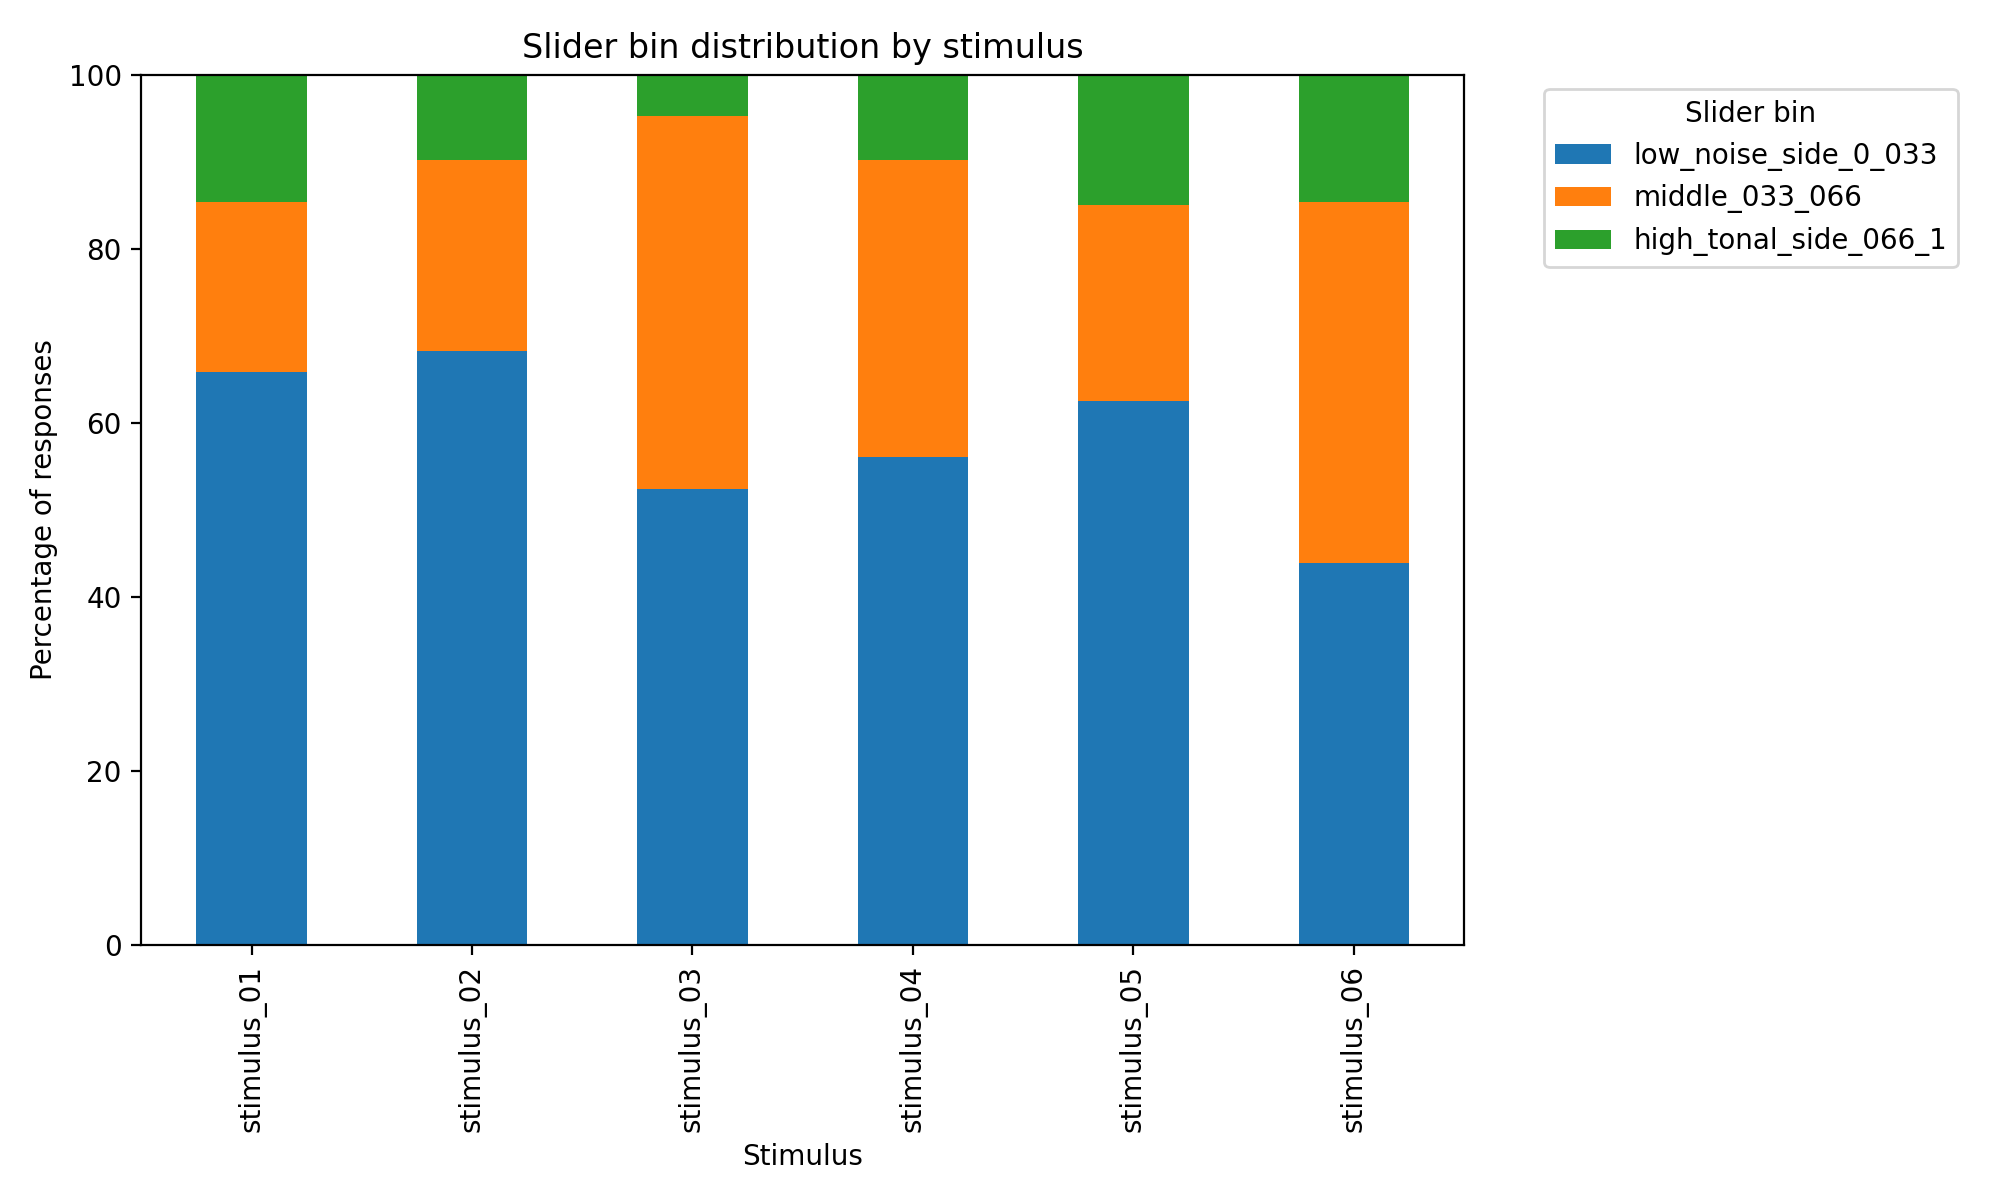
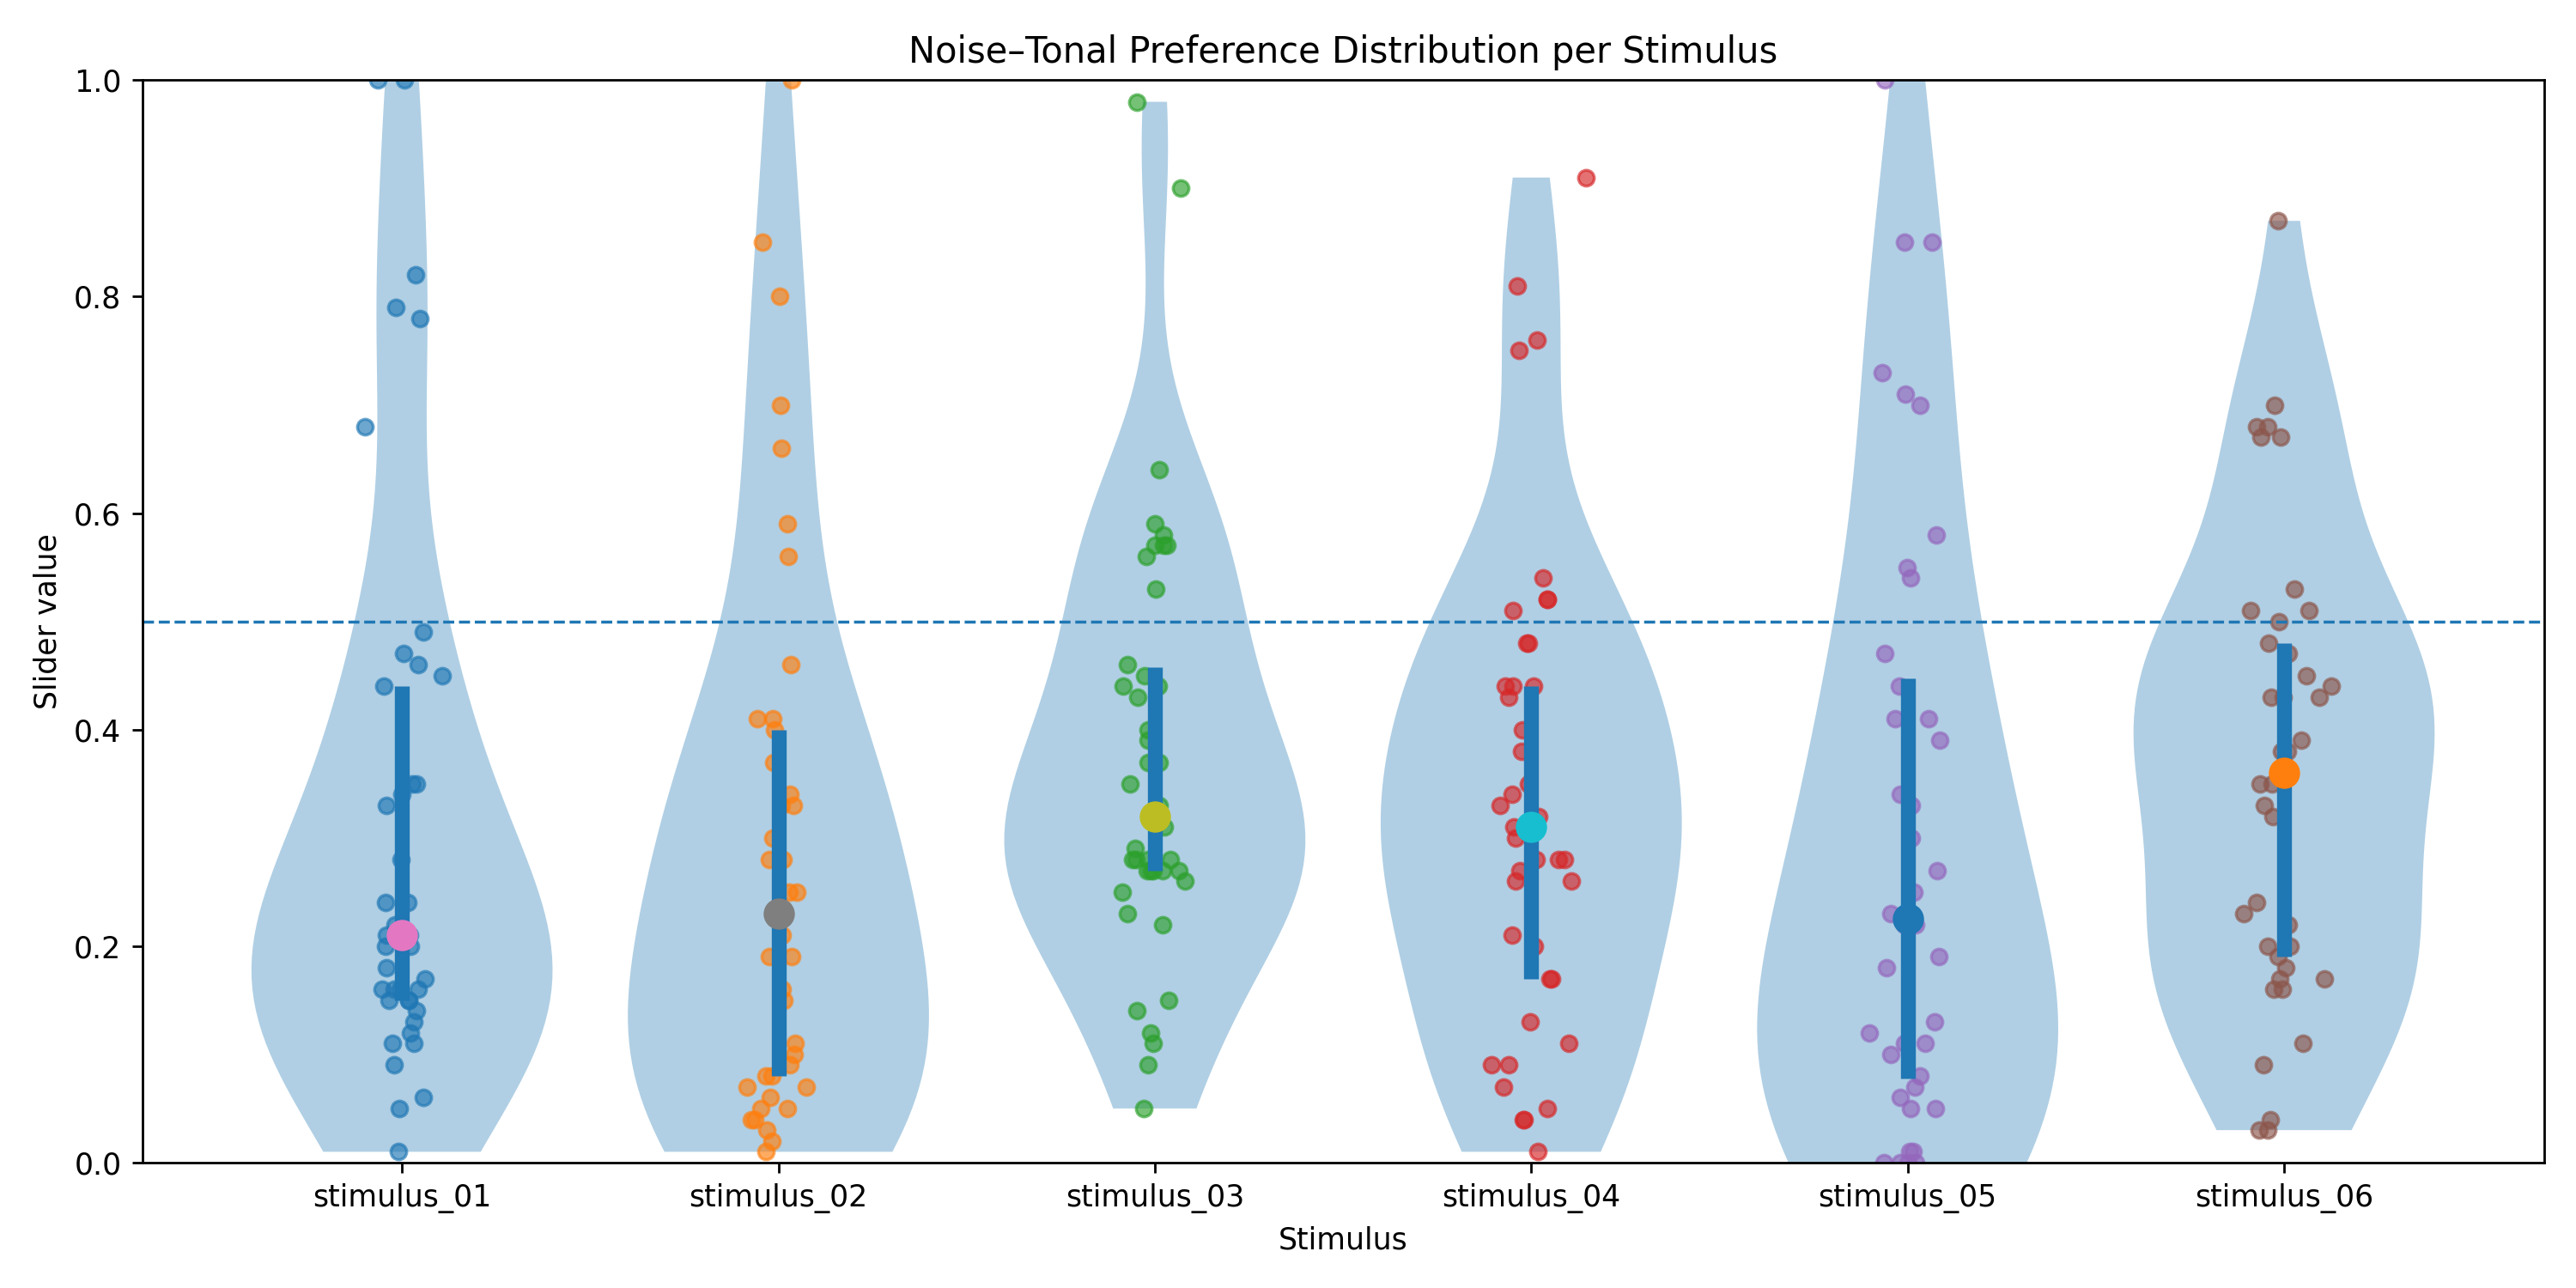
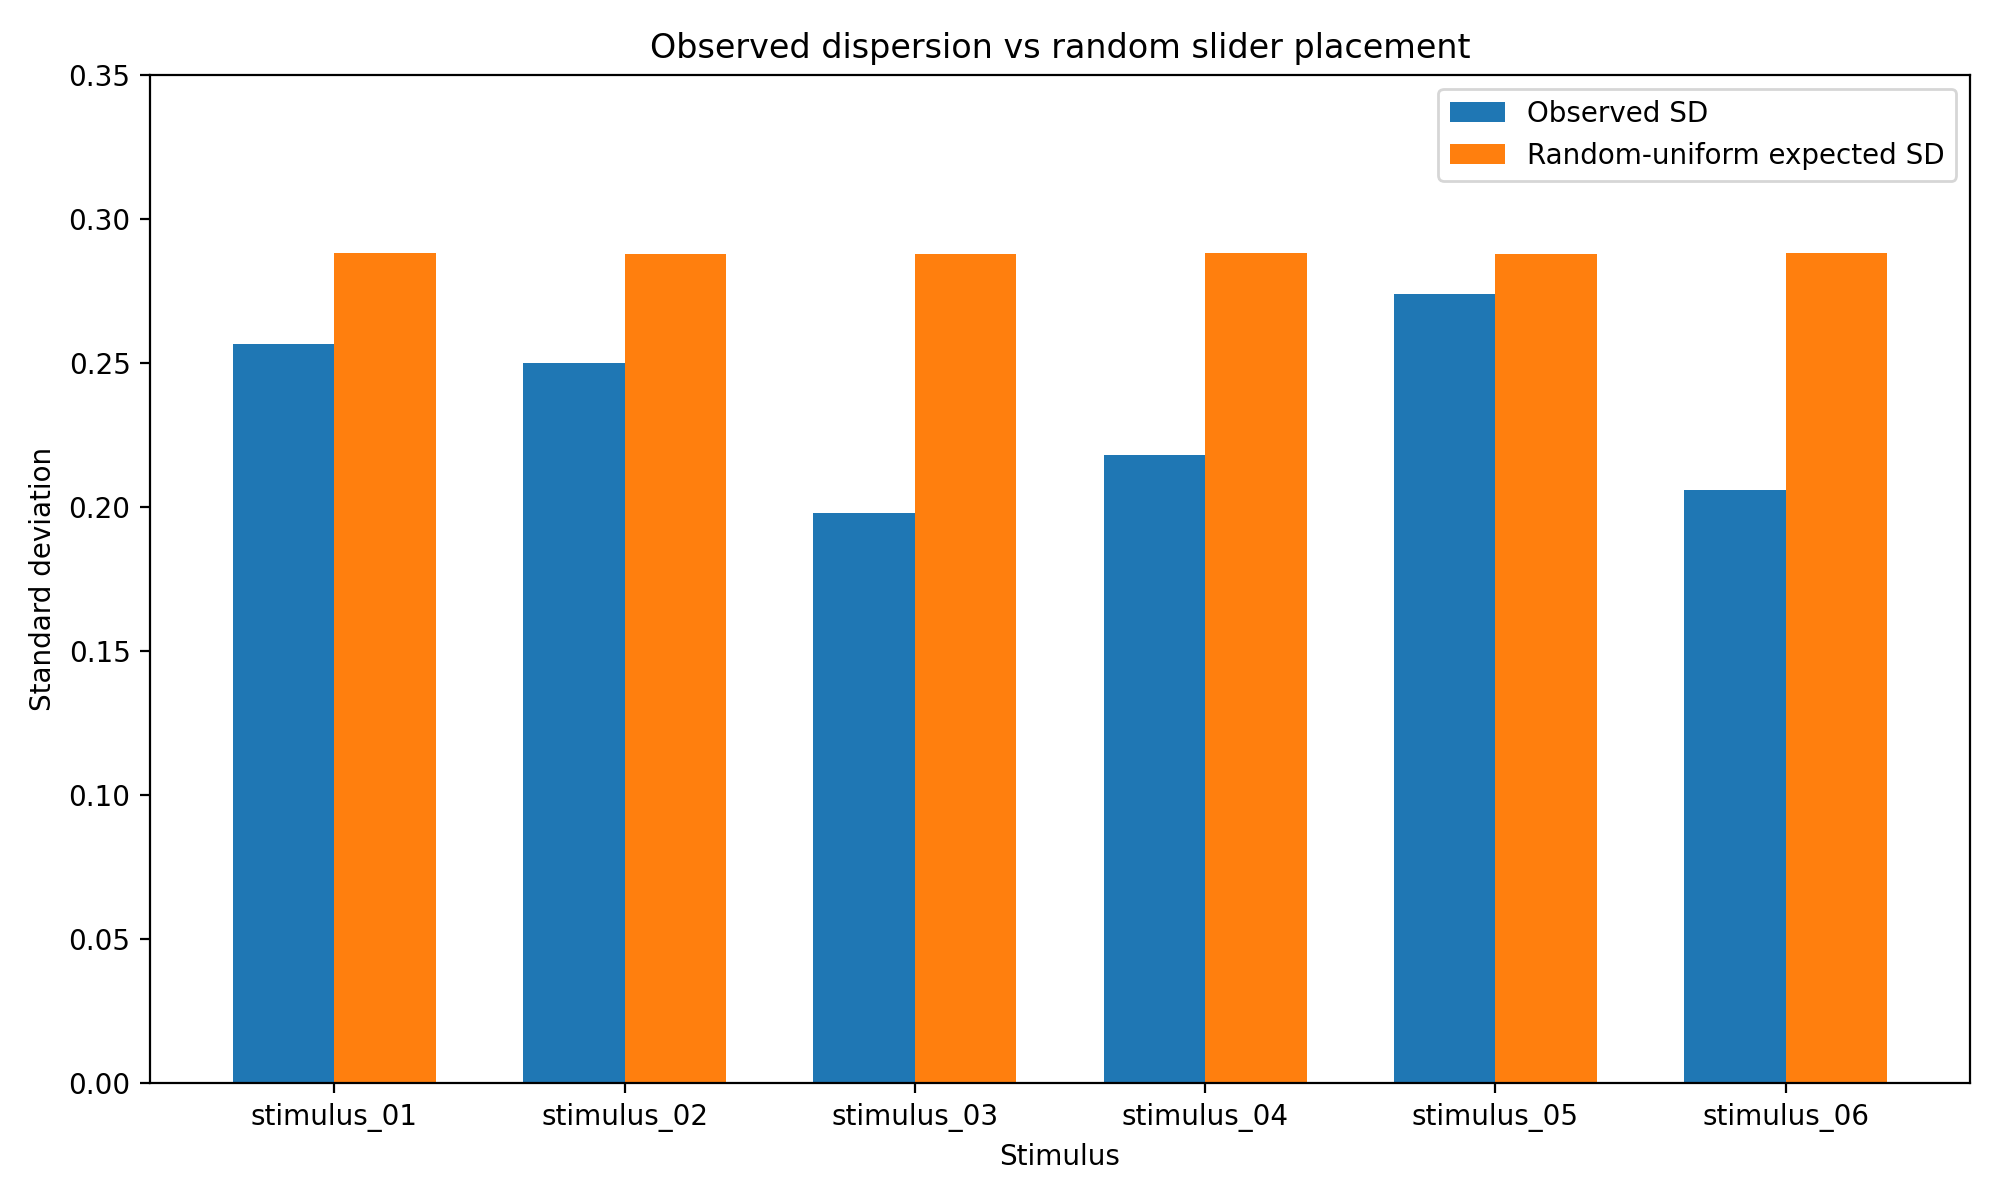
The existing analysis focuses on whether participants converged around shared slider regions rather than whether every stimulus received one exact value.
0.328
overall mean slider value
0.812
observed/random SD ratio across stimuli
Analysis figures
Mean slider value with bootstrap confidence intervals for each stimulus.Distribution of responses across perceptual slider regions.Participant response distributions shown as raincloud plots.Observed dispersion compared with a random-uniform null model.